
9.1. Sustainable mobilities#
Written by Marc Budinger, INSA Toulouse, France
This course is dedicated to the eco-design and Life Cycle Assessment of technological systems dedicated to sustainable mobility. This notebook is devoted to the transportation context and evolution. This introduction draws heavily on the analyses carried out in Aurelien Bigo’s thesis:
Bigo, A. (2020). Transport facing the challenge of energy transition. Explorations between the past and the future, technology and sufficiency, acceleration and slowdown (Doctoral dissertation, Institut Polytechnique de Paris).
9.1.1. National Low Carbon Strategy#
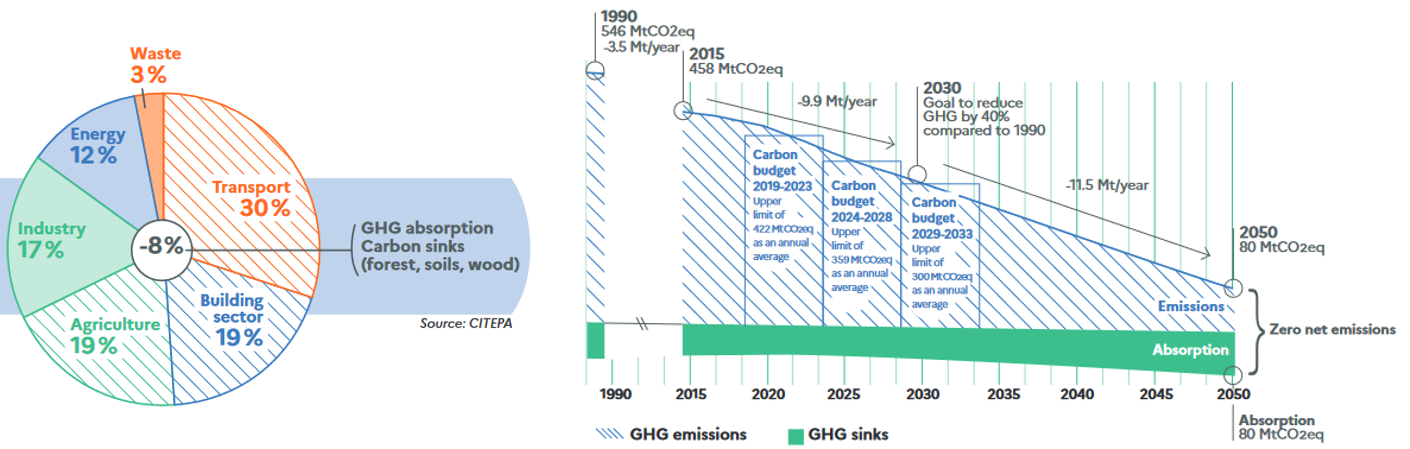
The National Low-Carbon Strategy (SNBC) is France’s roadmap for reducing its greenhouse gas (GHG) emissions. It concerns all sectors of activity and must be supported by everyone: citizens, local authorities and businesses. The aim is to reduce greenhouse gas emissions by a factor of 5 by 2050, compared with 2015 levels. Transport accounts for a significant proportion of these emissions (around 30%) and will therefore have to change if we are to meet these targets.
GreenHouse Gas (GHG) emmissions and absorption in France in 2017 - SNCB prospective scenario of achieving carbon neutrality by 2050
9.1.2. Breakdown of the evolution of greenhouse gas emissions from transport#
Index decomposition analyses (IDA) are used to characterise the factors that explain environmental impacts. The IPAT identity is expressed as follows:
\(Impact = Population \times Affluence \times Technology\)
The “Affluence” factor characterizes wealth per person. Japanese researcher Yoichi Kaya proposed an adaptation of this indicator to break down an economy’s CO2 emissions at an IPCC (Intergovernmental Panel on Climate Change) conference. Kaya’s identity breaks down CO2 emissions into four factors: population (Pop), wealth or GDP (gross domestic product) per person, the energy efficiency of the economy, and the carbon intensity of energy:
\(CO_2=Pop \times \frac{PIB}{Pop} \times \frac{Energy}{PIB} \times \frac{CO_2}{Energy}\)
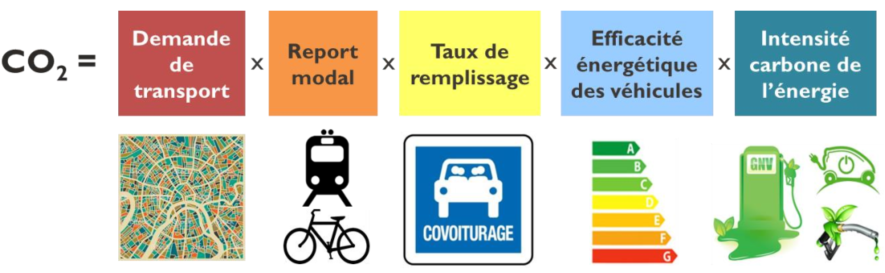
The identity retained in Aurélien Bigo’s study on the CO2 impact of transport retains five factors which are demand, modal shift, occupancy rate, energy efficiency and carbon intensity. The decomposition is also done by adding the effects of each mode of transport:
\(CO2_{Transport} = \sum D \times \frac{D_i}{D} \times \frac{C_i}{D_i} \times \frac{E_i}{C_i} \times \frac{CO2_i}{E_i}\)
With:
\(D\): the demand for passenger or goods transport (voy.km or t.km), i.e. the number of kilometers traveled by travelers and by tonnes of goods transported, with 1 t.km = 1 ton of goods traveling 1 km.
\(C_i\): circulation of mode i vehicles (veh.km: vehicle.kilometer)
\(E_i\): energy consumed by mode i (toe: tonne of oil equivalent)
\(CO_{2,i}\): CO2 emissions from mode i (tCO2: ton of CO2)
The five key levers for decarbonizing transport, used in the breakdown of emissions
9.1.3. Analysis of the evolution of transport emissions over the period 1960-2017#
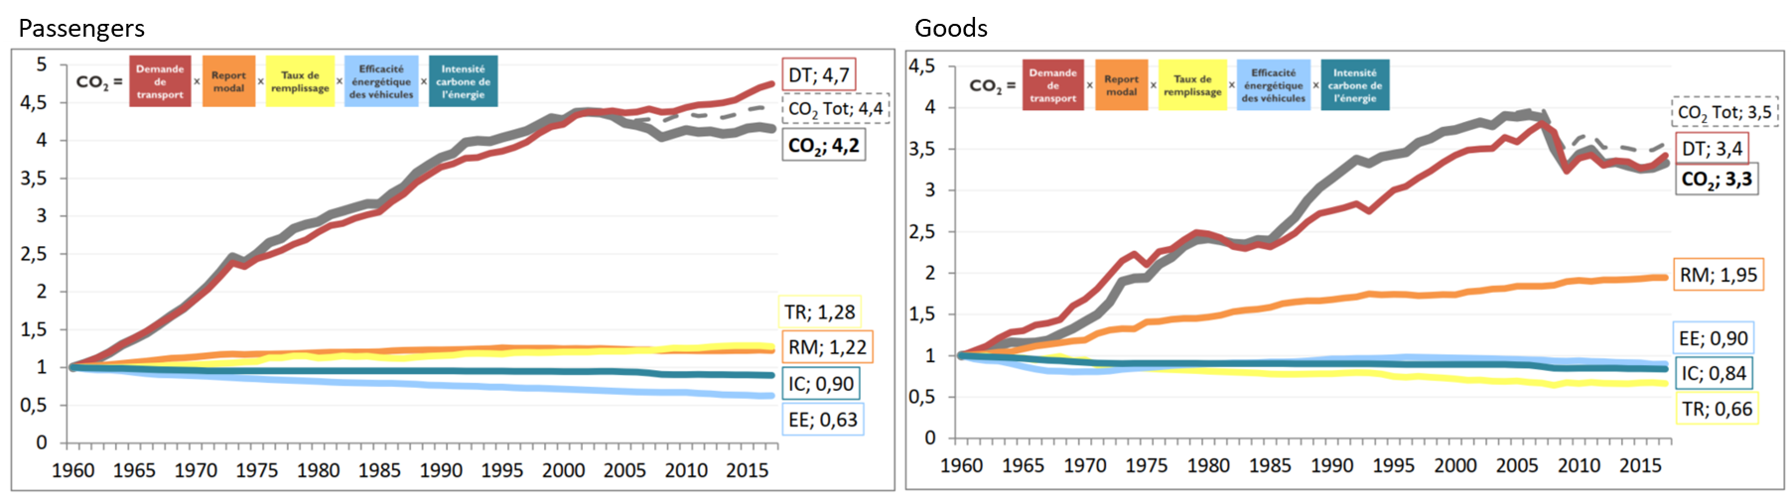
The graph below represents the multiplicative decomposition of the evolution of CO2 emissions from the transport of people and goods from 1960 to 2017. Demand was the main factor explaining the development of emissions over the period, for both passenger and freight transport. The decoupling between demand and emissions is very weak over the period, the other factors having largely offset each other: the factors increasing emissions are the modal shift and the filling of cars, while the filling of heavy goods vehicles, energy efficiency, and carbon intensity is declining.
Multiplicative decomposition of the evolution of CO2 emissions from passenger and goods transport, 1960-2017
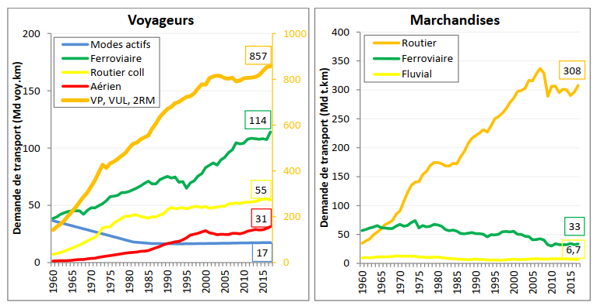
It is possible to carry out an analysis by development factors and means of transport. The following graphs illustrate in particular over this same period 1960-2017:
evolution of demand by means of transport
the modal shares of modes of transport of goods in France
the average occupancy of all land passenger and goods transport (passenger average = road + rail, excluding air and active modes; goods average = all modes)
the evolution of energy efficiency per transported unit (in gep/voy.km for passengers or gep/t.km for goods)
the evolution of the carbon intensity of energy for different modes compared to 1960
Evolution of the development factors and means of transport, 1960-2017
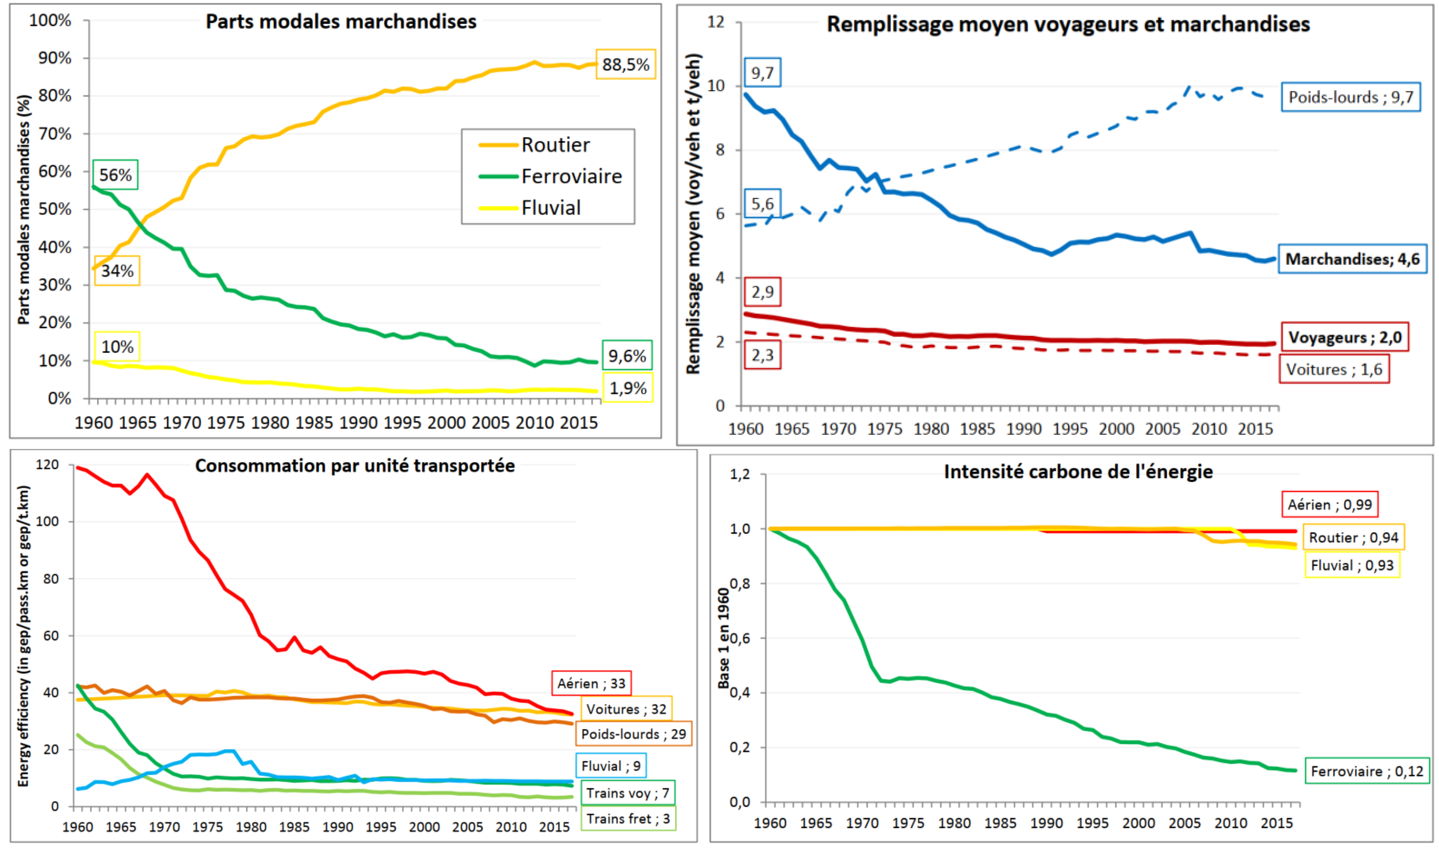
We can note in particular that:
Transport demand has been the main driver of changes in emissions in the past. It is influenced by many short and long term factors: population, GDP, fuel prices, land use planning, speed and costs of transport, etc.
The modal shift was mainly towards road modes over the period, despite a slight shift towards trains for travelers since the end of the 1990s.
The vehicle occupancy rate has improved for almost all modes with more capacity vehicles, except for cars which are an exception.
The energy efficiency of vehicles has steadily improved, partly offset by significant increases in weight and filling for certain modes.
Carbon intensity has changed little over the period, apart from the end of coal in the railways in the early 1970s, and the development of biofuels, the life cycle analysis of which actually shows emissions similar to oil.
9.1.4. Objective et course layout#
This course aims to provide tools to engineers wanting to participate in the eco-design of new modes of transport. The case studies will notably deal with technological systems allowing:
a modal shift from the car to public transport with high occupancy rate as electrical bus.
electrification of this public transport while minimizing the need for new heavy infrastructure as catenaries or ground power systems.
optimization of energy efficiency thanks regenerative braking.
minimization of carbon intensity over the entire life cycle.
Global course outline for systems engineering students:
Tools for the specification of technical systems via the generation and analysis of mission profiles : Application to collective urban transport such as tram, trolleybus, bus
Models and methods for presizing : Application to the sizing of a battery/ultracapacitor packs
Estimation models for the sizing of a DC-DC converter: scaling laws, linear regression, surrogate models
Sizing code of a DC-DC converter : inductor and global converter
Life cycle assesment LCA of DC-DC converter.
Course outline for power electronics students:
Architecture description and sizing for a full ultracapacitor application
Estimation models for the sizing of a DC-DC converter: scaling laws, linear regression, surrogate models
Sizing code of a DC-DC converter : inductor and global converter
9.1.5. Homework#
Homework 1: Test your knowledge on this Quiz: dedicated to the energy transition in transport
Homework 2: Read chapter 4 of A. Bigo thesis and propose a product/system to reduce the CO2 impact of transport. Explain what are the lever(s) used by this solution.